Factor investing analysis reveals: 2024 breaks with conventional wisdom
EQUITY INSIGHTS | No. 41

- Analysis of established factors shows that 2024 brought highly heterogeneous developments.
- From an absolute perspective, only the Momentum factor delivered outperformance amid high index concentration.
- Lack of risk control in portfolio construction was penalised with weaker performance.
How did factor strategies perform in 2024?
From a global equity index perspective, 2024 was an exceptionally strong year for markets. Regardless of whether currency effects were hedged, global equities posted double-digit gains. While the calendar year may appear, at first glance, to have been a relatively "easy” one for investors, a closer look reveals a far more heterogeneous picture beneath the surface. The dispersion or the performance spread among actively managed global equity strategies, was unusually high. The key reason: strong global equity performance was driven by just seven U.S. stocks. As a result, any active investment strategy that did not significantly overweight these names was penalised.
In this context, we examine the performance of factor strategies in 2024 to identify the underlying return drivers of active strategies. For this analysis, it is essential to focus on pure factor returns. All non-targeted effects are therefore neutralised relative to the global equity market. In practical terms, this means the following constraints must be applied during portfolio construction:
- Country allocation: max. +-1%
- Sector allocation: max. +-1%
- Individual stock deviation: max. +-1%
- Factor exposure: Max. +-0.01 standard deviations relative to the benchmark
This ensures that the desired factor characteristics result from the breadth of the portfolio and that the performance of the strategy does not depend on individual companies or is influenced by idiosyncratic events.
This approach ensures that the targeted factor exposure is derived from broad portfolio characteristics, rather than being driven by individual stocks or influenced by idiosyncratic events.
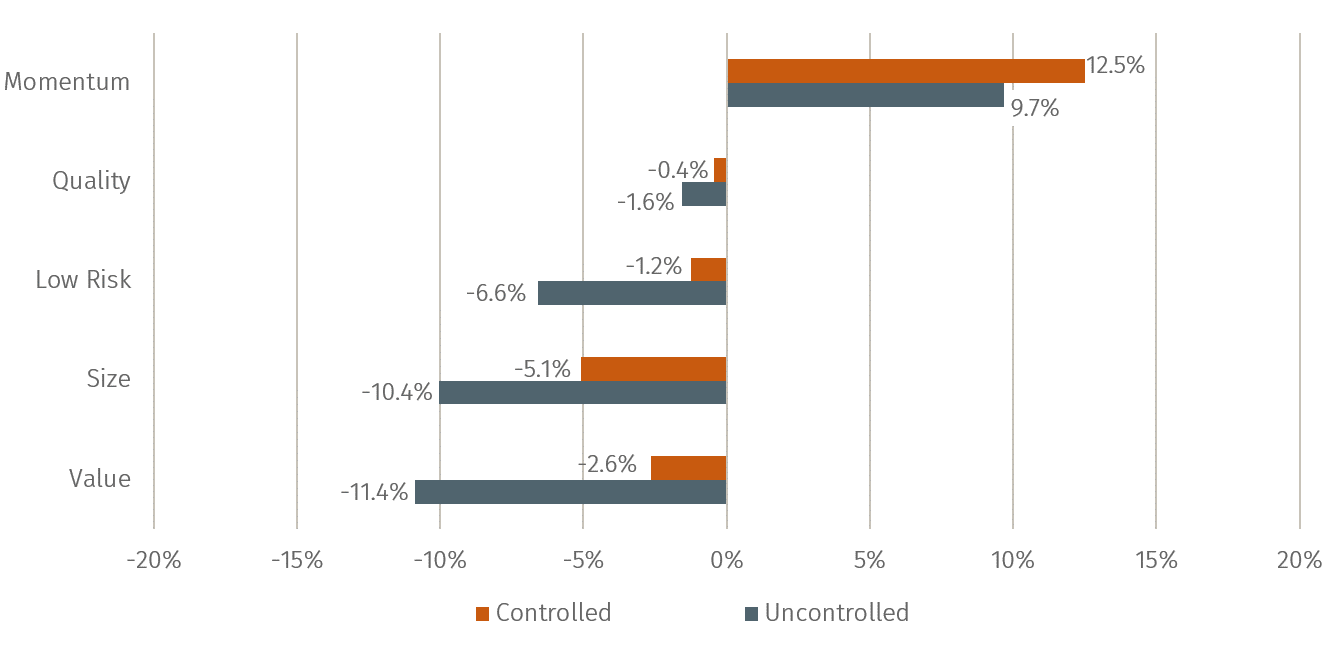
In the absence of proper risk control during portfolio construction, 2024 delivered some unexpected results, as shown in Figure 1. Within this framework, the current Equity Insights article analyses the performance of well-known factor strategies, with a particular focus on the drivers behind their respective returns. Special attention is given to how a lack of holistic risk management influenced outcomes. The analysis centres on the five widely recognised factors: Value, Quality, Size, Low Risk, and Momentum.
Figure 1 summarises the annual performance of the respective global factor indices. For each factor, we present both a controlled strategy and an uncontrolled variant. The latter is represented by widely used global indices that serve as the basis for multi-billion-dollar ETFs. While these indices aim to capture the respective factor exposures, they often exhibit unintended side effects due to a lack of holistic risk control.
At first glance, it is clear that in 2024, uncontrolled side effects were penalised with weaker performance – regardless of whether the factor itself performed positively or negatively relative to the global equity market. Over the long term, these unintended exposures are not rewarded and often carry elevated relative risks. However, such effects tend to be penalised particularly when the targeted risk premium underperforms. Conversely, when the factor outperforms the global market, uncontrolled strategies often deliver stronger returns than their controlled counterparts.
Not so in 2024, as evidenced by the Momentum factor: a holistically constructed Momentum strategy outperformed an uncontrolled version by nearly 3 percentage points.
Value and Size were the two weakest performers in 2024 from an absolute perspective. A closer look at their unintended exposures reveals significant regional underweights in the U.S. (both with around 34%) and overweights in Japan (Value: approx. 18%, Size: approx. 10%) and Europe (Value: approx. 18%, Size: approx. 14%). Additionally, both indices were similarly exposed to negative Momentum – by far the most dominant return driver in 2024. The uncontrolled Low Risk index also exhibited undesirable country allocation effects, though to a lesser extent.
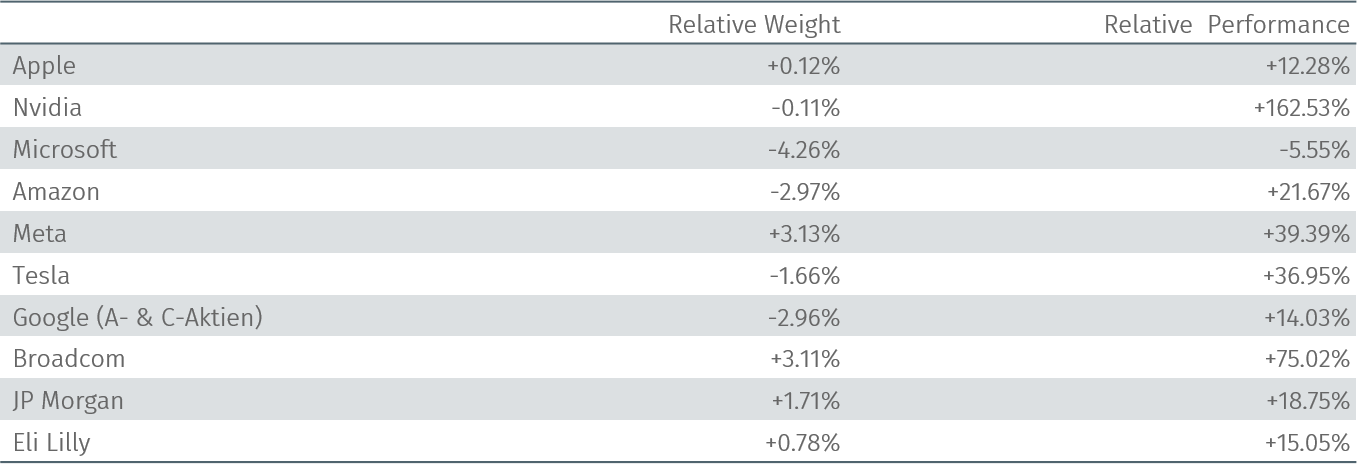
Table 1: Top 10 holdings in the uncontrolled Momentum Index – relative weights and performance vs global equity market in 2024
Assenagon Equity Framework
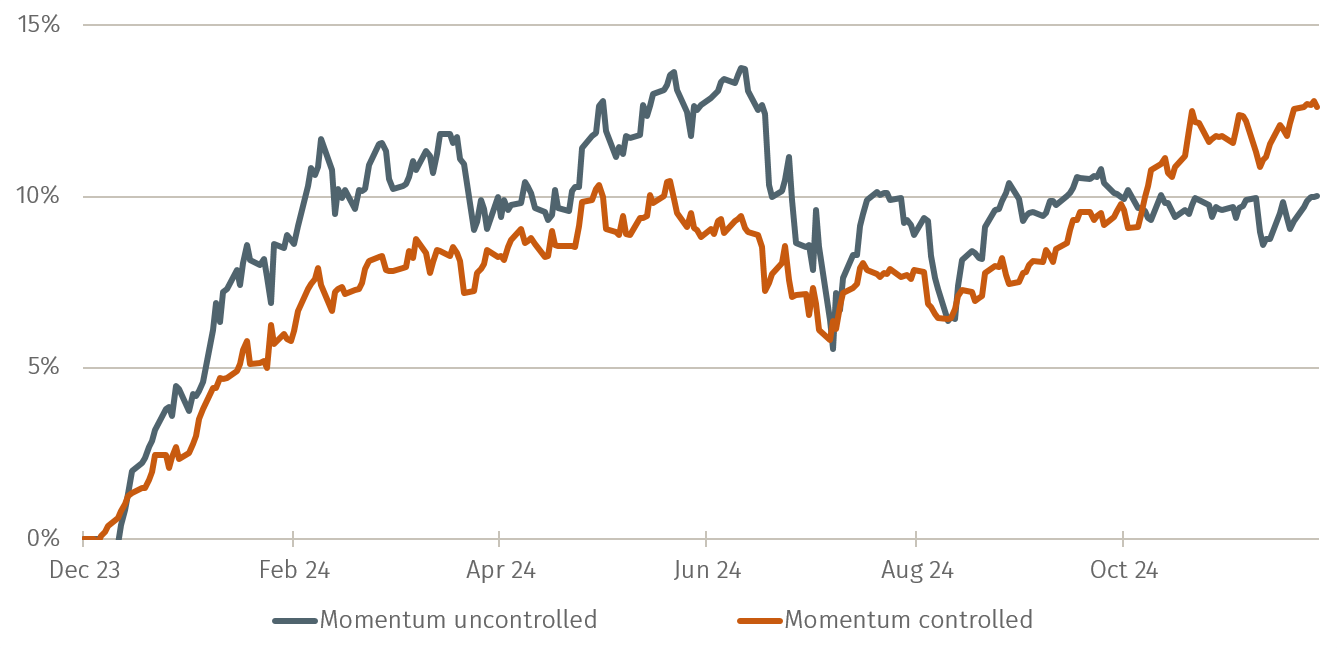
As previously noted, Momentum presents an interesting case. A controlled strategy has outperformed during this favourable market phase for the Momentum premium. Figure 2 illustrates the relative performance of both Momentum variants against the global equity market. Both delivered at least a 10% outperformance in 2024. However, performance patterns differ. The uncontrolled Momentum index outperformed in H1 but subsequently gave back some gains. This is surprising given the largest deviations observed. Country allocation in this index is relatively neutral, while sector exposures show notable differences (Financials vs Consumer Discretionary). The most significant bets are concentrated in individual stocks, with the top 10 holdings showing a cumulative deviation exceeding 20%.
For the investor
Table 1 shows that although these companies largely delivered strong outperformance in 2024, the uncontrolled Momentum strategy did not fully capitalise on this, especially in the second half of the year.
Overall, it is clear that the additional risks from uncontrolled side effects were not rewarded. In fact, during the strong Momentum year of 2024, these risks even resulted in lost outperformance.
PS: In the next issue, we will explore the key return and risk metrics investors should prioritise.


