Growth investing: unique factor or reflection of established market dynamics?
EQUITY INSIGHTS | No. 37

- While academic literature does not attach much importance to the topic of growth investing, the topic is very popular in practice.
- The Global Growth Index occasionally shows significant sector and factor deviations compared to global equity markets.
- The performance of the growth index can be explained for the most part by two known effects and therefore does not represent a separate premium.
Is there a growth factor?
No other topic has dominated the stock markets as much as technology in recent years. However, there are numerous other companies, not necessarily in the sector, that demonstrate a similarly dynamic growth profile and performance. This prompts the question of whether there is a distinct premium behind these developments – a growth factor, which not only explains the observations of the past decade but also rewards investors in the future with an average outperformance compared to the global equity market.
Despite a lack of economic rationale or scientific studies with positive findings, the topic of growth investing has enjoyed great popularity for decades. In addition to a large number of actively managed strategies, there are also a number of passive index funds. We consider this an opportunity to explore the practical implications of growth factors.
Performance of growth stocks since 2000
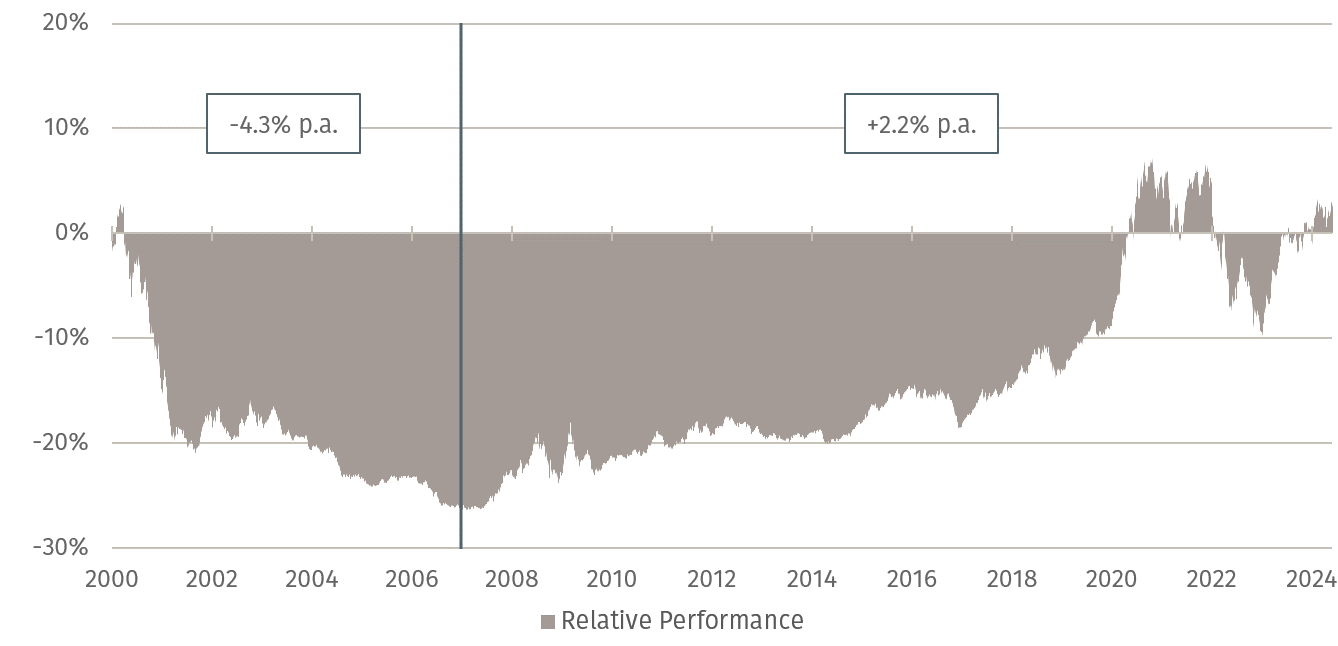
When examining the relative performance of the global growth index in relation to global equity markets (Figure 1), it is clear that growth investors have faced significant challenges. At the beginning of the 2000s, growth stocks significantly hindered performance: up until just before the outbreak of the global financial crisis, the growth index underperformed the global equity market by -4.3% per annum. With the onset of the financial crisis, the relative performance changed, allowing the growth index – except for the year 2022 – to generate a steady outperformance of 2.2% per annum against the global equity market until May 2024. Nevertheless, the growth index has only marginally outperformed global equity markets over both time periods. Only if these cannot be explained by sector or well-established factor effects, such as value or quality, can a distinct growth factor be identified.
Technology stocks dominate the landscape
Table 1 examines the largest sector deviations of the growth index relative to the global equity market. Unsurprisingly, the technology sector stands out significantly, with an overweight of 13.6%.
Due to the underlying growth profile of the companies, this is hardly surprising; however, it often accompanies a high valuation of the companies. The next largest overweights are in the Consumer Discretionary (4.2%) and Communication (3.3%) sectors, which can largely be attributed to the following four firms: Amazon and Tesla (both in Consumer Discretionary), and Alphabet and Meta (both in Communication). Once again, these are companies with a dynamic growth profile, but ultimately accompanied by a higher valuation (and one could certainly argue they have a close association with the Technology sector). On the other hand, there are underweights in the Health (-2.3%), Energy (-3.3%), and Financials (-7.4%) sectors.
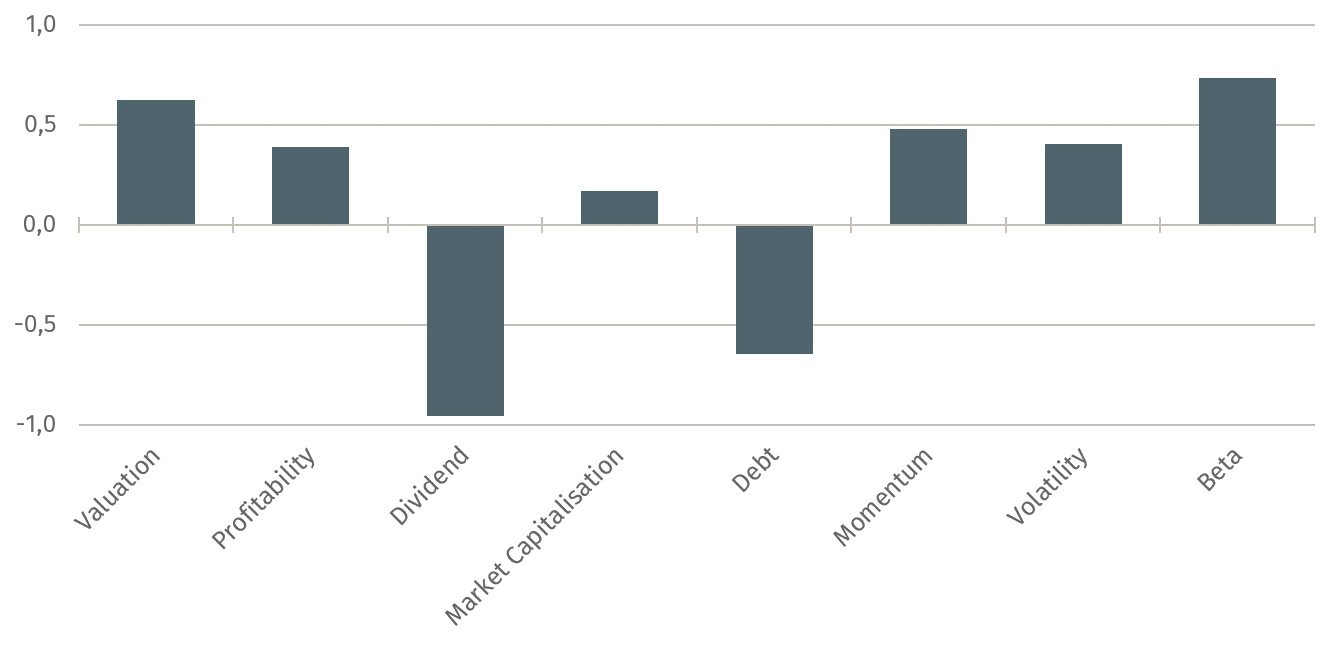
In Figure 2, the picture of sector deviations continues at the level of the factor profile: the growth index exhibits a high valuation, lower dividend yield, and increased risk – factors that, over the long term, tend to negatively impact return expectations. In contrast, and in line with the overweight in technology stocks, there is above-average profitability, low debt, and higher momentum—all positively emphasised, value-driving factors. The growth index therefore displays both advantageous and disadvantageous factor characteristics.
Assenagon Equity Framework
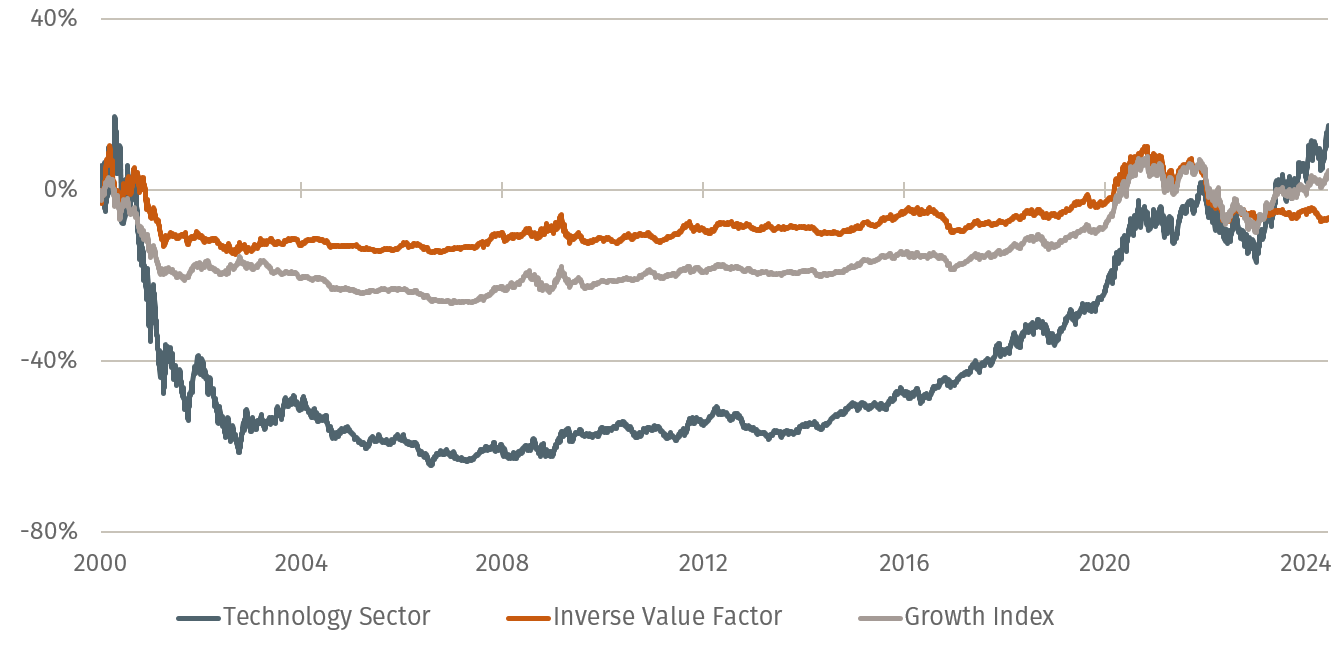
While it should already be clear that a variety of effects contributed to the performance of the growth index (for example, quality characteristics of higher profitability and lower debt), we will conclude by focusing on the two most striking effects in the overall context: the technology sector and the high valuation of companies. Whereas the return impact of the technology sector can be easily illustrated using a corresponding sector index, we calculate an inverse value factor for the aspect of high company valuations. This portfolio does not assign any characteristics to country, sector or other factor effects and thus reflects the pure performance of the opposite of value.
For the investor
What the analysis of the sector and factor effects already suggests is confirmed in Figure 3. It shows that the relative performance of the growth index over the past 24 years can be largely explained by the movements of the inverse value factor. However, two market phases stand out: the end of the dotcom bubble (2000 – 2003) and the years 2023 and 2024. Here, the performance of the growth index decouples to some extent from that of the inverse value factor. In both instances, these phases can be attributed to the overweight in the technology sector, which experienced exceptionally strong fluctuations during the dotcom bubble burst and again in the past two years, as reflected in the performance of the growth index.
P S: Read in the next issue about the impact of the Magnificent 7 on well-known factor strategies.


