Mega Caps: worth having or not?
EQUITY INSIGHTS | No. 38

- The Mega Cap rally has resulted in index concentration reaching an all-time high—an increasing challenge for investors.
- The influence of Mega Caps on the return/risk spectrum of active strategies—regardless of style—is greater than ever before.
- Excluding Mega Caps from the portfolio results in a form of size bias in any strategy—even when only allocating to large caps.
The challenge of Mega Caps
Few topics challenge investors as much as the performance of the so-called Mega Caps. On one hand, this has resulted in global equity markets being more concentrated than ever before, consequently lacking the usual level of diversification. On the other hand, a significant portion of the performance can be attributed to an expansion in company valuations.
In the current article, we examine how Mega Caps affect the performance of well-known factor strategies. Furthermore, we illustrate how this issue can be addressed from the perspective of portfolio construction and risk management.
What influence do Mega Caps have?
To gain a detailed understanding of the general influence of Mega Caps on performance, two distinct portfolios are constructed for all factors: one based on the entire global equity market, including the top 10 companies, and another without those top 10 companies. In both cases, market capitalisation is used as the weighting scheme (subsequently abbreviated as "MCAP" and "MCAP ex Top 10").
As usual, the portfolios are constructed using the Assenagon Equity Framework. This approach emphasises the desired factor, such as value, in comparison to the benchmark, which is the global equity market. All other characteristics, such as sector or country allocation and additional factors, are maintained at a neutral level in comparison to the global equity market. Therefore, the performance relative to the global equity market is determined exclusively by the specific factor, or in the case of MKAP ex Top 10, additionally by the exclusion of the largest ten companies.
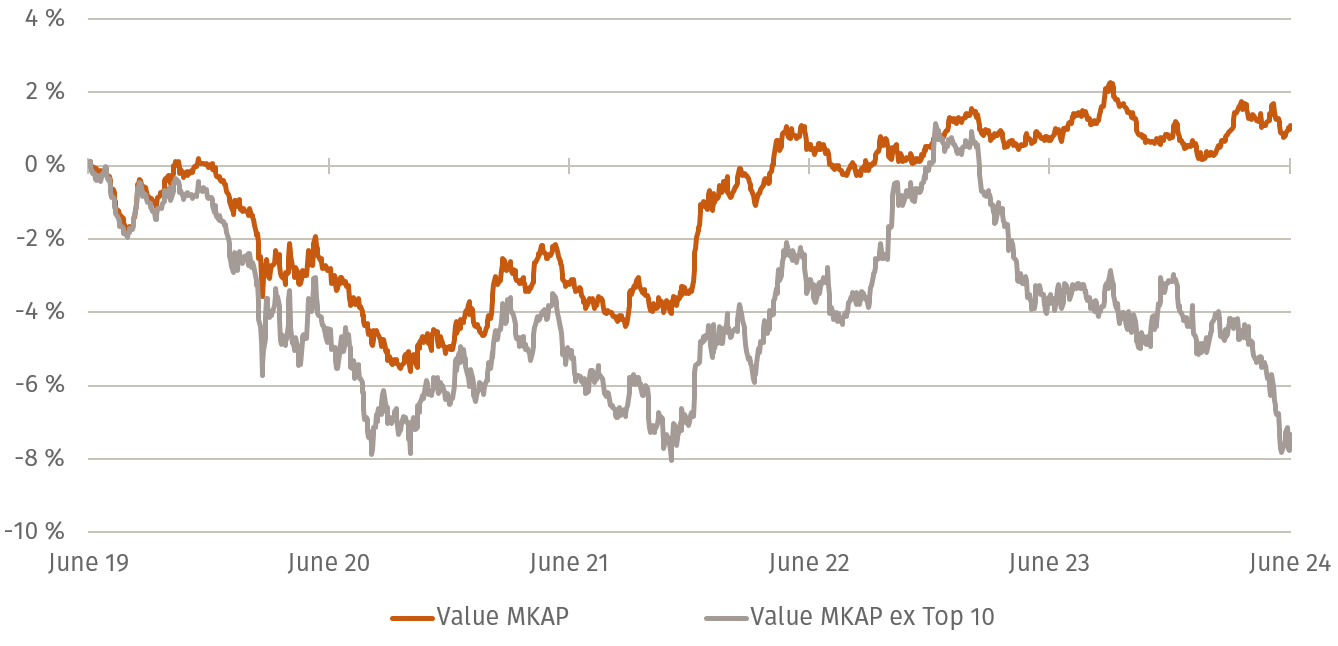
In Figure 1, we illustrate the relative performance of both portfolios against the global equity market, exemplified for the Value factor. It is clear that the exclusion of the ten largest stocks has a significantly negative impact on performance: over the past five years, there is a difference of -8.4 percentage points between the two variants. Conversely, it is also evident that the value factor, despite the rally of the (primarily technology-heavy) Mega Caps, has managed to generate a slight outperformance of +1.1 percent against the global equity market since June 2020.
Table 1 complements Figure 1 by summarising the results for all other factors: Regardless of the respective style, the exclusion of the ten largest companies had a significant negative effect – depending on the factor selected, the impact over five years was between -5.2 per cent and -8.6 per cent.
A review of the cumulative relative performance over five years for the respective factor without exclusion indicates a slight outperformance, with two exceptions. The momentum factor has demonstrated the strongest performance over the past five years. Conversely, the size factor demonstrated the poorest performance on a consistent basis.
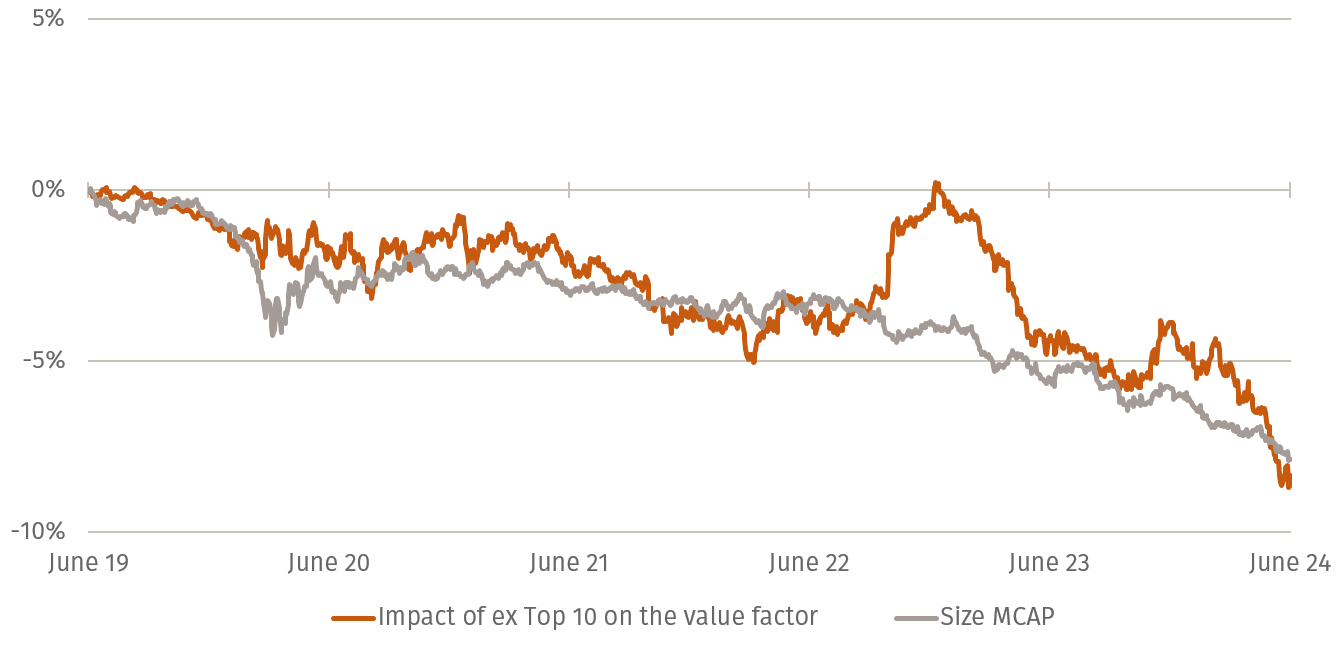
Interestingly, the exclusion of the top 10 companies results in a similar outcome, regardless of the chosen factor. Not only is the difference between the two portfolios negative in all cases, but the absolute returns of the factors over the past five years are also negative without the top 10 stocks in all instances. From these results, it can already be inferred that the size factor plays a significant role. For illustration, Figure 2 shows in orange the difference between the two value portfolios from Figure 1, as well as the relative performance of the market capitalisation-weighted size factor without exclusions (MCAP).
The size factor gives a positive weighting to small and mid-cap stocks and a negative weighting to large caps in comparison to the global equity market. The Value factor ex Top 10 has no allocation to the ten largest companies and therefore does not deviate in terms of average market capitalisation from the global equity market, which is size neutral. However, the similarity of the two time series indicates that the exclusion of the top 10 companies represents a significant portion of the size factor. The rationale behind this is the growing concentration of the global equity market. Currently, the ten largest companies account for approximately 25% of the index weight. This indicates that, by excluding these stocks, a portfolio already demonstrates an active share of 25 percent. As a result, there is a significant impact on the portfolio's return and risk.
Assenagon Equity Framework
It is therefore evident that, when investing, it is not sufficient to consider only the components of the portfolio; one must also take into account the exclusions, such as MKAP vs MKAP ex Top 10. Despite pursuing a value strategy, as illustrated in the initial example, which does not deviate in terms of size characteristics from the benchmark, the exclusion of mega caps similarly affects performance.
Figure 2: Difference Value MCAP & MCAP ex Top 10 vs relative performance size faktor against the global equity market
(June 2019 - June 2024)
For the investor
As previously outlined in earlier articles (Equity Insights #30 & Equity Insights #31), the Mega Cap effect represents a distinctive phenomenon. This indicates that the performance cannot be explained by known return effects, such as those related to sector or factor. It is therefore essential to exercise caution when selecting underweights in the top 10 stocks and to approach this decision in a considered manner. In light of current valuation levels and their discrepancies across market capitalisation, an underweighting of Mega Caps may prove a prudent strategy. As history shows, every rally eventually reaches its end.
P.S.: Read in the next issue which Mega Caps are making their way in the factor portfolio.


