Risk metrics in practice
EQUITY INSIGHTS | No. 42

- Equity investors should consider relative risk measures at least as much as absolute ones.
- A peer group analysis of global Value strategies reveals a negative correlation between relative risk and realised returns.
- A well-managed relative risk profile does not preclude active management or a high Active Share.
Relative risk illustrated
When investors consider the risks of their equity investments, terms such as tracking error, active share, or relative maximum drawdown are surprisingly seldom mentioned outside of index-tracking strategies – and often unjustly so.
Typically, every investor maintains a certain equity allocation at all times – exemplified by the Strategic Asset Allocation (SAA) approach, which is now widely adopted. While there are occasional Tactical Asset Allocation (TAA) adjustments, these rarely involve a complete divestment. In summary, the majority of investors consistently hold some equity exposure.
Against this backdrop, it is all the more surprising that equity risk is typically assessed in absolute terms rather than relative ones. Regardless of the chosen benchmark (Global, Europe, etc.), a key question remains: how much does one’s equity allocation deviate from it?
Three key metrics are particularly useful for quantifying this relative risk:
- Tracking error:The volatility of relative/active returns (investment minus benchmark)
- Relative price decline: The largest cumulative underperformance versus the benchmark
- Active share:The percentage overlap of individual holdings with the benchmark, ranging from 0% to 100%.
0% Active Share = perfect replication of the benchmark.
100% Active Share = no overlap with the benchmark.
Next, we ask: what does a tracking error of 2%, 5%, or 10% actually mean?
Using a simple simulation of an active investment strategy, we illustrate this based on the following parameters:
- Annual outperformance of 1.5%
- 10-year investment horizon
- 10,000 simulation paths
- Tracking error scenarios: 2%, 5%, and 10%
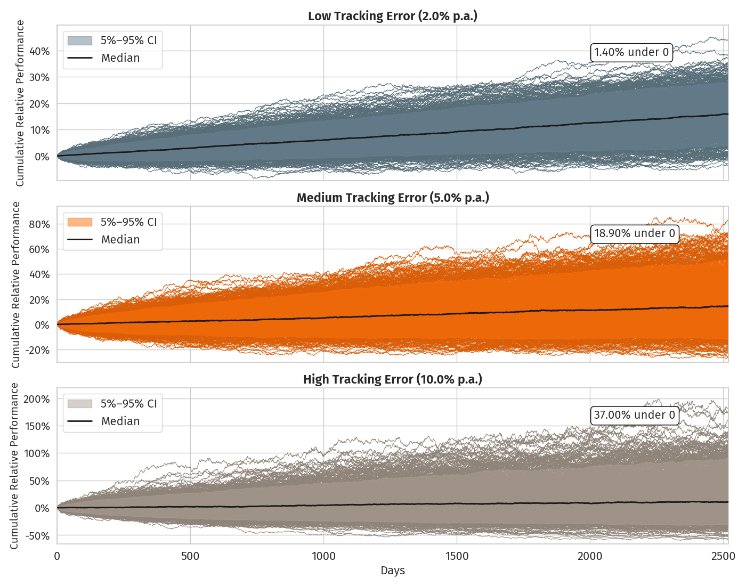
Figure 1 illustrates the outcomes for each tracking error scenario. Based on the parameters, an average annual outperformance of 1.5% versus the benchmark is achieved after 10 years in every case. However, as tracking error (relative risk) increases, the results deviate significantly from the expected value. In other words, even if one had absolute certainty that an active equity strategy would deliver positive net returns over the long term, it remains possible – even under generous assumptions – to underperform the market after 10 years.
The magnitude of cumulative deviation, however, increases significantly with higher relative risk. While a tracking error of 2.0% per annum results in outperformance relative to the market in nearly every simulation path, at a tracking error of 10%, over 35% of cases underperform the market – sometimes by a substantial margin.
Fig. 1: Simulation of relative performance over 10 years
In a theoretical model world, it can be argued that, according to the law of large numbers, the expected outperformance will eventually be realised regardless of relative risk. In practice, however, investors must contend with the following questions:
- Is the investment horizon truly long enough to wait for the strategy to pay off?
- Can temporary underperformance or relative drawdowns be tolerated?
- How strong is the conviction regarding the expected outperformance?
Especially regarding the last point, a clear statement can be made in practice: estimating expected returns – or even their distribution – is truly a bold assumption.
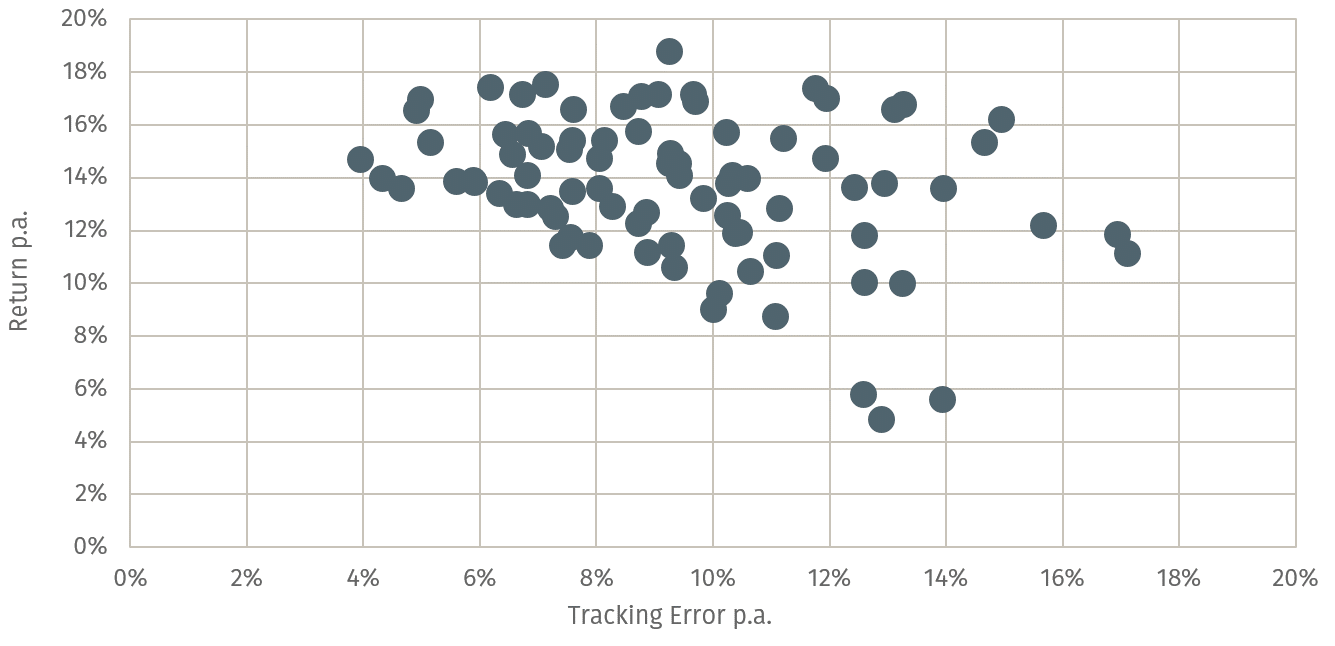
To bridge the gap between simulation and real-world outcomes, we analysed peer groups of actively managed equity strategies over the past five years. As an example, the following analysis focuses on global Value strategies. Figure 2 plots annual returns against tracking error, revealing significant dispersion in both risk and return despite the shared objective of investing in undervalued stocks.
Interestingly, there is a slight negative correlation: the higher the relative risk, the lower the achieved return – mirroring the pattern observed in the simulation results.
Fig. 2: Annual return/risk of the Value peer group over the last 5 years
Assenagon Equity Framework
Within the context of the theoretical simulation – based on rather generous assumptions – it is clear that high relative risks are not rewarded. Nevertheless, it is notable that a significant portion of global Value strategies exhibit tracking errors of 10% p.a. or more.
Even the theoretical simulation shows that with a tracking error of 10% and a "guaranteed" outperformance of 1.5% p.a., the benchmark is underperformed in over 37% of cases after 10 years.
For the investor
In summary, relative risk measures should be considered at least as much as their absolute counterparts. Furthermore, investors should critically assess the level of tracking error they are willing to tolerate.
What is certain is that stock returns do not follow a classic normal distribution; extreme events – so-called 3-sigma events, which lie far outside statistical norms – occur relatively frequently in practice. This means that with a tracking error of 10% p.a., a relative deviation of 30% or more is very likely to materialise over time.
A well-managed relative risk profile does not preclude portfolio activity: active shares of 80% can be implemented comfortably with a tracking error below 5%.
PS: In the next issue, read about the difference between position and positioning.


