Diversification and mega cap investments – incompatible?
EQUITY INSIGHTS | No. 39

- Rather than excluding Mega Caps for diversification purposes, investors should consider strategically underweighting or overweighting them to effectively manage portfolio risks.
- By deliberately incorporating Mega Caps, investors can stay aligned with their strategy while effectively managing single-stock risks.
- Given the significant idiosyncratic effect of Mega Caps, factoring them in is essential to accurately reflect market structure.
Diversification made easy?
The seemingly simplest way to maintain diversification within today’s highly concentrated indices is to exclude Mega Caps from portfolios. However, as we demonstrated in our previous article (Equity Insights #38), this is a misconception. Such an exclusion would result in an active share of 25 percent without any active management at all. While this approach may provide a degree of protection against a potential correction in elevated company or Mega Cap valuations, the period leading up to such a correction – if it occurs – could present challenges.
To effectively address index concentration in portfolio construction, a strategic underweighting or overweighting of key companies is advised. In this article, we explore the role of mega caps within established factor strategies.
Inclusion of Mega Caps within the factor portfolio
Consistent with our methodology, the portfolios have been constructed holistically within the framework of our Assenagon Equity Framework. This approach ensures that, relative to the benchmark – the global equity market – only the selected factor, such as value, receives special emphasis. All other characteristics, such as sector or country allocation or other factors, are maintained at a neutral level in comparison to the global equity market. In order to ensure a holistic portfolio construction, the underweights and overweightings of individual securities in comparison to the benchmark are also monitored. This guarantees that the desired factor characteristics originate from the breadth of the portfolio and are not dependent on a few individual positions.
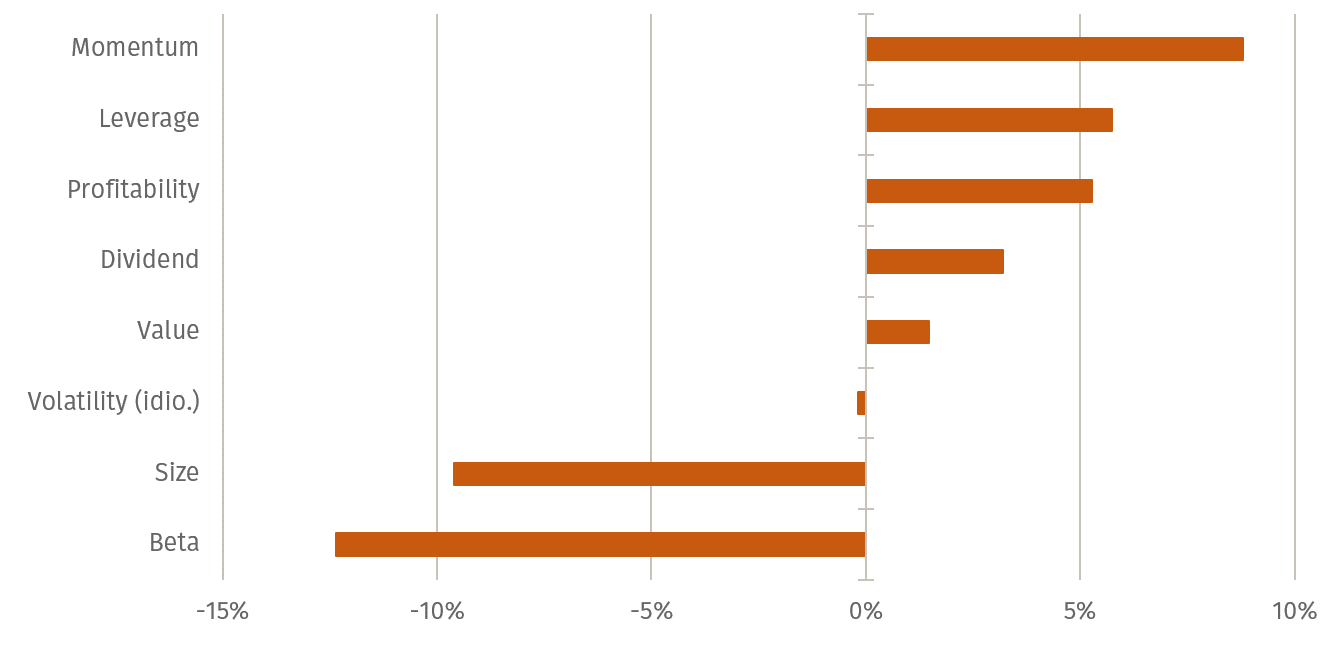
Figure 1 shows the relative performance of relevant factors in the Assenagon Equity Framework compared to the global equity market over the past five years. The result is highly heterogeneous: while the low beta factor underperformed by more than 12 %, the momentum factor is almost 9 % ahead.
Interestingly, the value and dividend factors are slightly ahead of the global equity market. Considering that in the broad perception of the investor landscape over the past five years, there was only one year in which value "ran", namely in the inflationary environment of 2022 - a quite surprising result. However, we construct factors holistically, which means that the value factor has the same allocation to US equities and technology companies as the global equity market. And inevitably, mega caps are also represented - the only question is which mega cap is under- or even overweighted in the respective factor?
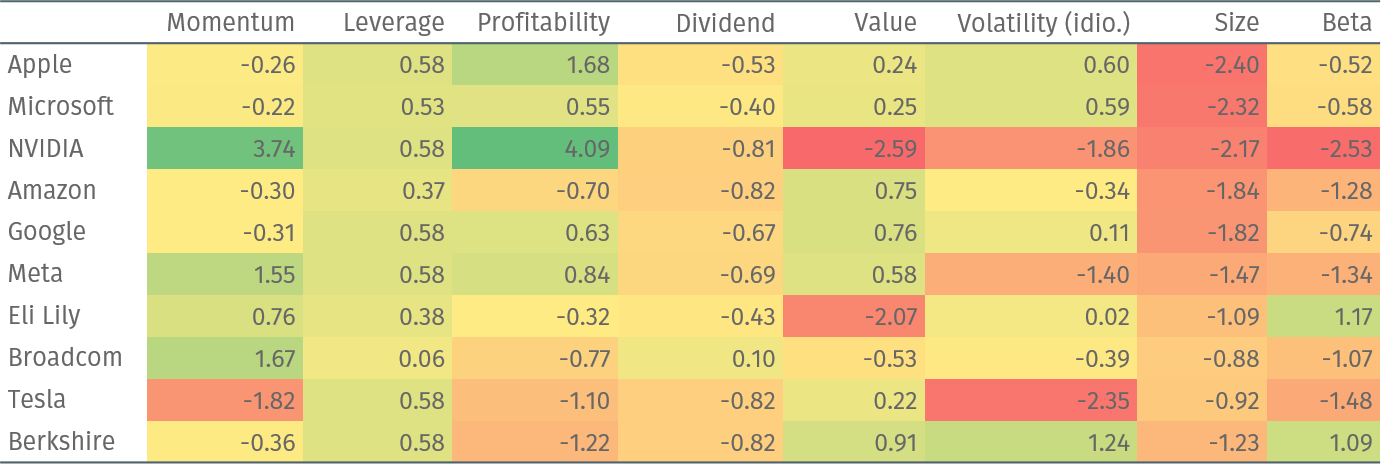
Table 1 shows the characteristics of the ten largest companies in the global equity market in relation to the respective factor. The respective characteristics do not give a 1:1 indication of the absolute underweight or overweight, but they do provide a good indication. As we construct portfolios holistically, it is not only important to reflect the exposure to the factor we are looking for, but also to keep all other factors neutral. For example, a value strategy may slightly overweight a technology company whose valuation is "in line" with its sector. However, this company may have high profitability, low debt and momentum, making it an attractive addition to the portfolio.
Assenagon Equity Framework
Over the past five years, there has been a notable correlation between the outperformance of the respective factor and the characteristics of the Mega Caps. To illustrate, the momentum factor reflects an overweight position in stocks such as Nvidia, Meta, Eli Lilly and Broadcom. For stocks like Apple, Microsoft, Amazon, and Google, the overweight position is minimal. Despite exhibiting slightly negative momentum, these stocks are distinguished by high profitability, minimal debt, and a comparatively favourable valuation. Therefore, these stocks provide valuable components for a momentum portfolio at a relatively low cost. Tesla's negative momentum results in a substantial underweight allocation.
It is inevitable that there will be instances where Mega Caps are underweighted due to the inherent limitations in their characteristics, particularly in cases where a size or low-risk strategy is being employed. However, as illustrated by the value example, a consistent relative approach can also identify companies with suitable valuations among the Mega Caps, resulting in some of them being included in the portfolio with an overweight. This is an effective method of considering the current global market structure with a 25% benchmark weighting in the top 10 stocks.
For the investor
The significant impact of the idiosyncratic Mega Cap effect underscores the need to consider it in portfolio construction. Maintaining alignment with your chosen strategy, such as a global value approach, is essential, while incorporating active risk management through targeted underweighting and overweighting helps mitigate individual stock risks.
PS: Discover how to construct an efficient Quality-Momentum Multi-Factor portfolio in the next issue.


