There are many ways to get to Paris
EQUITY INSIGHTS | No. 36

- Investment strategies for achieving the Paris climate targets are becoming increasingly popular.
- Paris-aligned indices are often exposed to significant risks.
- Investment strategies to achieve the Paris climate targets can also be implemented with significantly less risk.
Implementation of the Paris climate targets
In March 2018, the European Commission published an action plan for financing sustainable growth. This includes the development of standards for EU climate benchmarks, with a particular focus on decarbonisation. This is defined as the reduction of annual emissions, with the ultimate goal of limiting global warming to 1.5°C.
The EU Paris-Aligned Benchmark is typically the focus of institutional investors, representing a corresponding stock index aligned with achieving climate targets. Furthermore, the EU Climate Transition Benchmark provides an additional option for integrating climate targets into a stock portfolio. To provide a clearer picture, we will now examine the underlying specifics and differences of the two indices in more detail:
Both have in common that industries with a high impact on emissions are weighted at least as highly as in the baseline universe, annual greenhouse gas emissions intensity is reduced by 7% annually, and the topics controversial weapons, tobacco, violations of the UN Global Compact and OECD guidelines are excluded. However, there are differences in the baseline greenhouse gas emissions intensity (Scope 1 – 3) compared to the baseline universe. While the EU Climate Transition benchmark shows a reduction of 30% compared to the initial universe, the figure is 50% for the EU Paris-Aligned benchmark. In addition, the latter has some additional revenue-based exclusions:
- Coal (1% revenue cap)
- Oil (10% revenue cap)
- Gas (50% revenue cap)
Electricity generation > 100g CO2/kWh (50% revenue cap)
The following section provides a more detailed analysis of the implications of the criteria set out on the basis of the global Paris-Aligned Index, given that, as previously explained, it has much more restrictive requirements.
Side effects of the global Paris-Aligned Index
As expected, these criteria significantly influence allocation. For example, given the extensive exclusions implemented, Table 1 analyses the largest sector deviations from the global equity market.
Driven by these exclusions, the energy sector shows the largest deviation at -5.0%, followed by consumer staples at -4.2%. Companies within the technology sector, whose business models inherently tend to have low greenhouse gas emission intensity, are overweighted by 3.4%. Furthermore, the real estate and industrial sectors are overweighted by 2.3%, which may be surprising given that the industrial sector is often associated with "Old Economy" and is typically linked to high emissions. While the top three sector over- and underweights may suggest minor sector effects, the active share of 40.4% indicates that this alleged passive index maintains a substantial level of "activity".
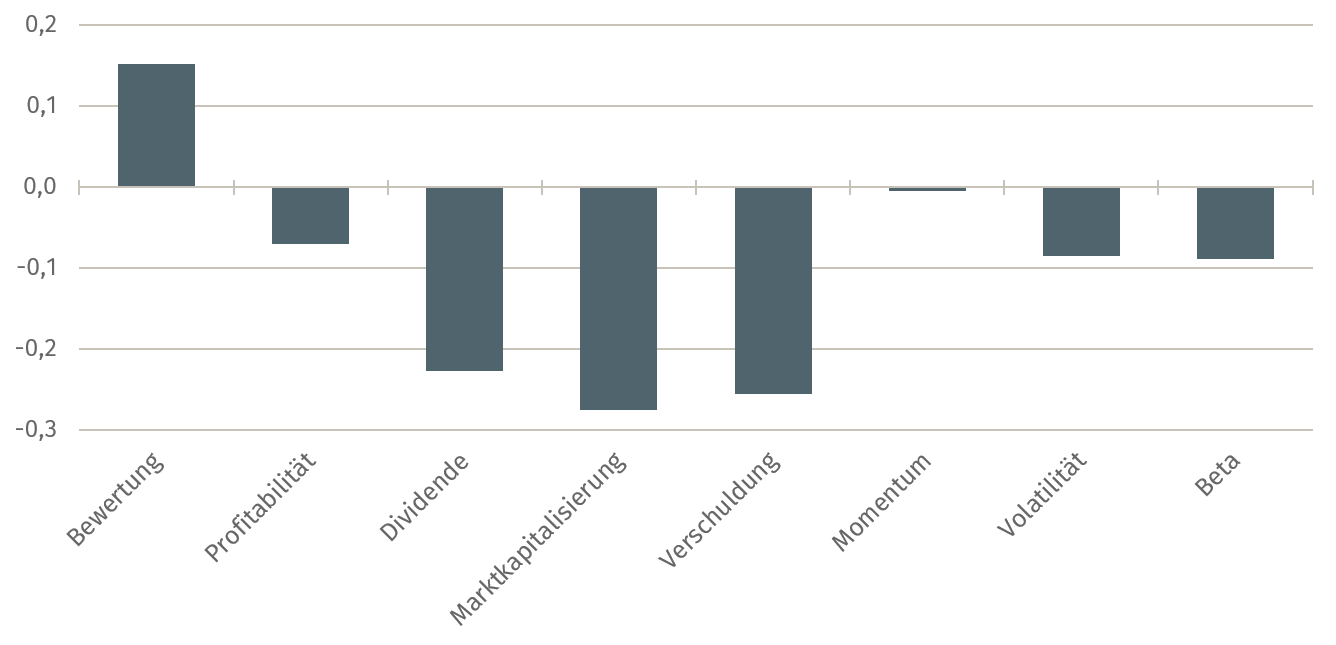
The high active share also continues when looking at the factor profile relative to the global equity market in Figure 1.
For example, the global Paris Aligned Index – partly a result of the sector deviations shown – has, among other things, a high valuation (negative value), low dividends, low market capitalisation (size) and low debt. In particular, the high valuation and the size characteristics have a significant influence on the performance of the Global Paris Aligned-Index.
Assenagon Equity Framework
By applying a holistic approach to portfolio construction, the side effects observed in the global Paris-Aligned Index can be significantly reduced. This means constructing an optimized portfolio that adheres to the Paris-Aligned criteria outlined at the outset, while minimizing deviations in country, sector, and factor allocations relative to the global equity market: the Assenagon Paris-Aligned Strategy.
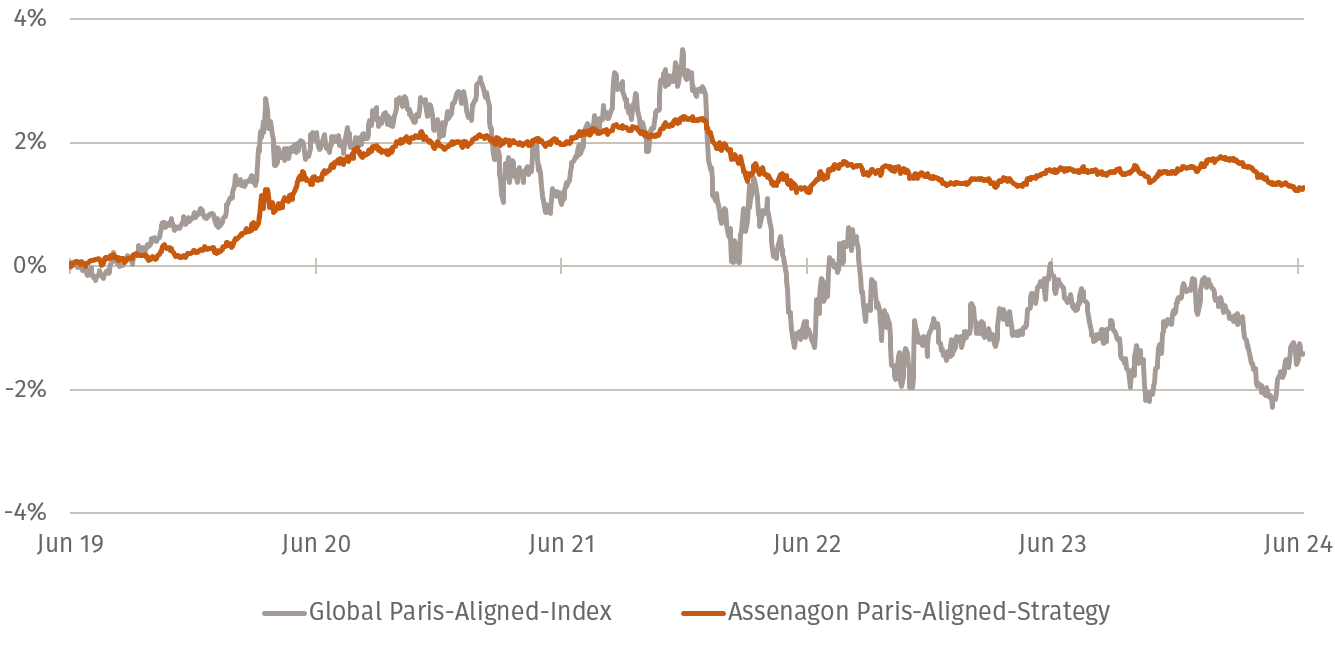
Figure 2 illustrates the relative performance of the global Paris-Aligned Index and the Assenagon Paris-Aligned Strategy compared to the global equity market over the past five years. As is clearly visible, the side effects associated with the global Paris-Aligned Index negatively impact its risk profile and, ultimately, its performance. Compared to the optimized version, the global Paris-Aligned Index shows a significantly higher tracking error and a relative maximum drawdown of -5.6%. This presents a considerable challenge for institutional portfolio allocation, especially for what is assumed to be a passive core investment. By contrast, the Assenagon Paris-Aligned Strategy demonstrates a significantly lower tracking error and relative drawdown, with the latter at -1.2% over the past five years.
For the investor
The Assenagon Paris-Aligned Strategy is by construction as close as possible to the global equity market across all risk and return dimensions, while demonstrating greater robustness compared to the Paris-Aligned Index. This indicates that investors can allocate their equity investments in line with achieving climate goals without sacrificing returns or incurring potential hidden risks.
The fundamental question, however, is why Paris-linked indices are so popular with investors, even though they carry significant risks. As discussed in Equity Insights # 19, a pure CO₂ reduction is relatively easy to achieve, while hard exclusions entail significantly higher risks.
P S: Stay tuned for the upcoming issue, where we will investigate whether the Growth factor truly exisits.


